ResearchPrepared: January 2026

2025 Observed Drawdowns and Dollar Risk Scenarios

Key findings

A risk budget cannot focus only on the worst single day. Maximum drawdown measures the cumulative loss from a prior closing peak to a subsequent low; the gain required to recover the original value exceeds the absolute percentage loss. This report first identifies the observed peak-to-trough path, then converts price scenarios into dollar amounts, without presenting historical drawdown as an upper bound on future losses.

Start with observed historical risk

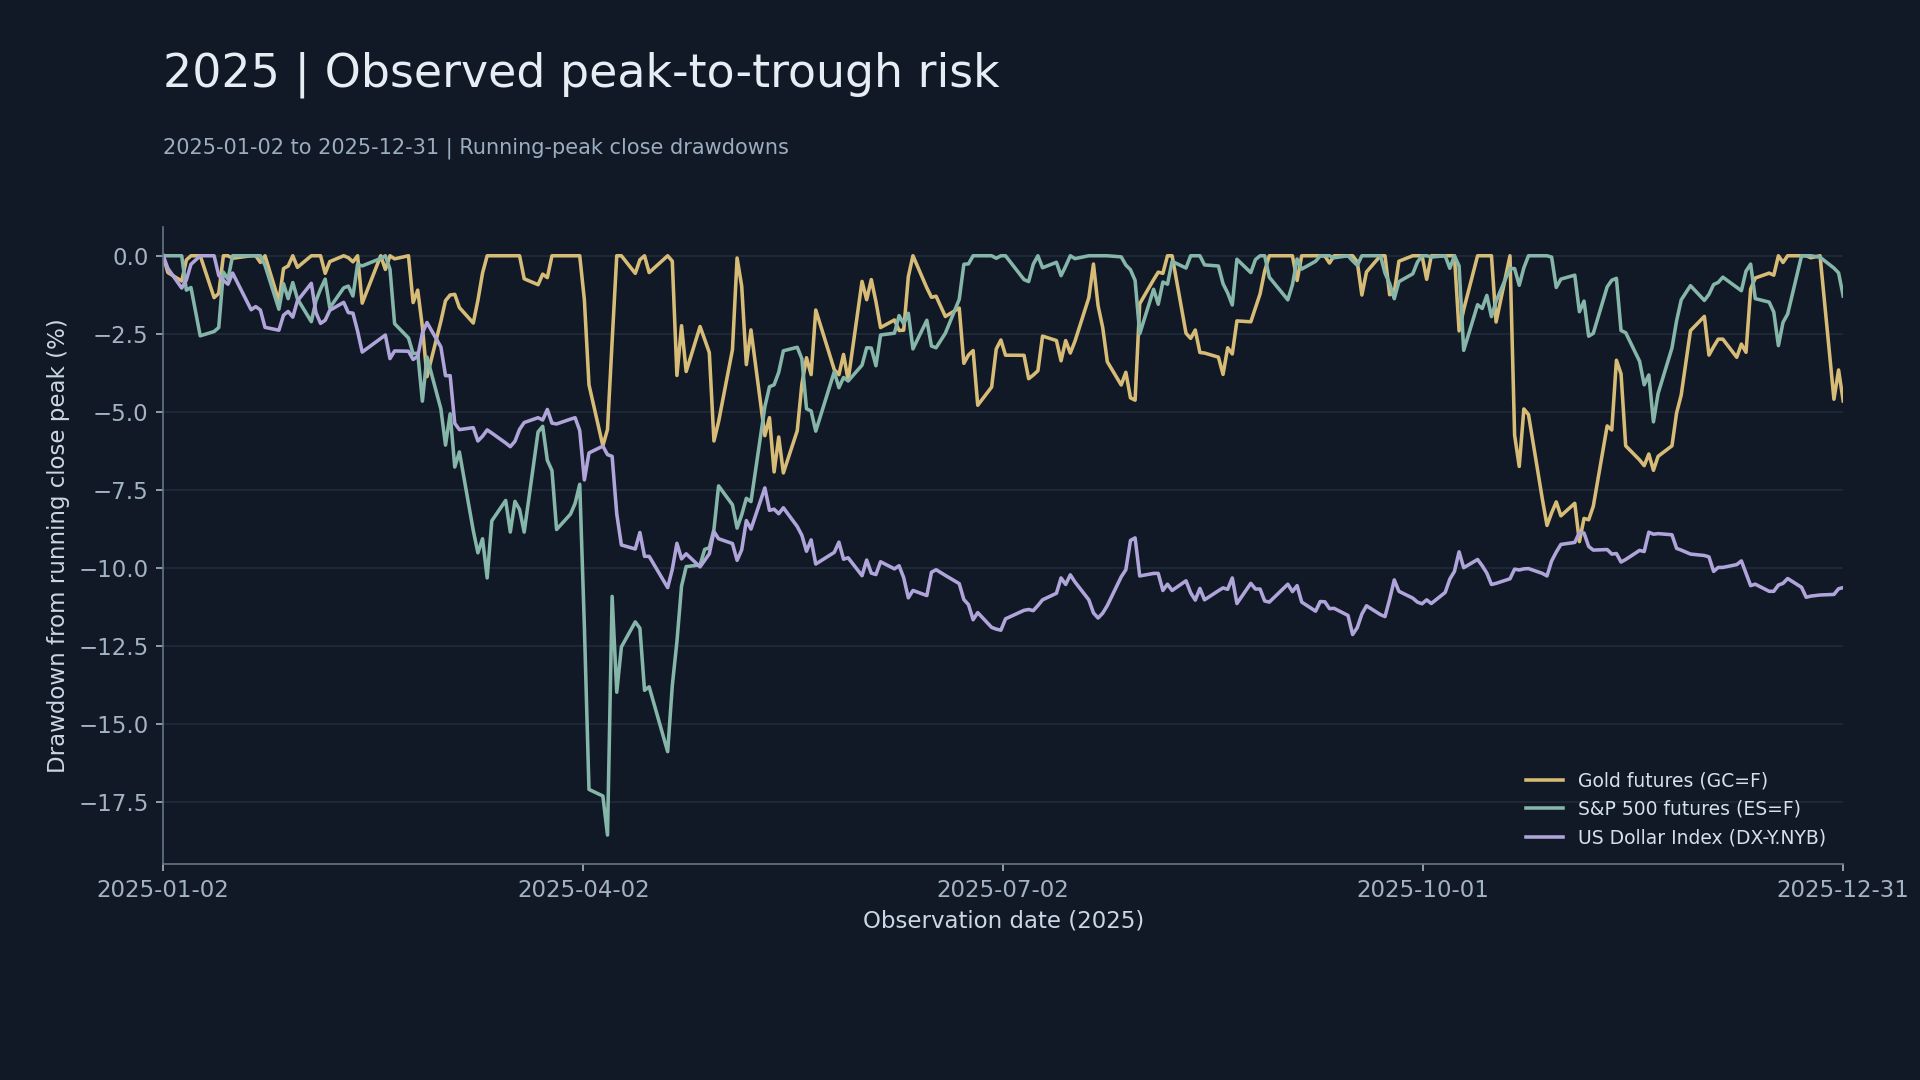
Each line uses actual closing prices from 2025-01-02 to 2025-12-31 to calculate the decline from the running highest closing price. The chart shows historical price changes, not simulated P&L series.

Calculating drawdown

For each date, calculate the highest closing price observed up to and including that day, then calculate daily close / running peak − 1. This measure excludes intraday lows and transaction costs.

From historical research to dollar scenarios

Use the risk calculator The calculator’s reference prices are from the last comparable trading day of 2025. Users enter notional exposure, direction, a price-change scenario and costs. Net P&L = notional exposure × price change × direction coefficient − round-trip costs. For a $100,000 long exposure, a −5% price change and $100 in costs, net P&L is −$5,100. This is a mathematical result under the specified assumptions; the historical chart does not use these assumed values.

Peaks, troughs and recovery dates

The running peak is the highest close up to and including each date. The table identifies the peak and trough associated with the deepest drawdown in the full sample. Recovery is the first close after the trough that reaches the previous peak. Otherwise, the result remains “not recovered within the observation period”; the sample’s end is not treated as recovery.
MarketClosing peak dateTrough dateMaximum drawdownFirst recovery date
Gold Futures2025-10-202025-11-04-9.15%2025-12-17
S&P 500 Futures2025-02-192025-04-08-18.54%2025-06-26
U.S. Dollar Index2025-01-132025-09-16-12.12%Did not recover within the observation period
These dates come from the same closing-price series and must not be mixed with intraday highs and lows. Intraday high-to-low drawdown and the closing-price drawdown in this table have different definitions and must be assessed separately.

Losses and recovery gains are asymmetric

A decline from 100 to 80 is a 20% loss, but recovering from 80 to 100 requires a 25% gain. Required recovery gain = 1 / (1 + drawdown) − 1. The recovery gains corresponding to this sample’s maximum drawdowns are 10.07% for gold, 22.76% for equity index futures and 13.79% for the U.S. dollar index. This calculation describes only the mathematical gain needed after a loss; it does not forecast the time to recovery. If a position was closed before the trough because of margin or liquidity constraints, a subsequent price recovery does not mean the investor recovered the loss.

Specify the denominator and position direction

The calculator takes notional exposure, not account equity. The direction coefficient is +1 for long positions and −1 for short positions; costs are deducted in dollars. Futures contract counts must first be converted to notional exposure using price, the contract multiplier and the number of contracts. A contract count cannot be treated as a dollar amount.
ScenarioLong net P&LShort net P&L
$100,000 notional exposure, price −5%, cost $100−$5,100+$4,900
$100,000 notional exposure, price +5%, cost $100+$4,900−$5,100
This is a linear scenario conversion and does not assume actual client or personal holdings. With only $20,000 in account equity, the long-position loss in the first row represents 25.5% of equity, not 5.1%. Changing the denominator materially changes the interpretation of risk.

Building a fuller stress test

Start with historically observed shocks, then add scenarios beyond the historical range. Also test price gaps, spread widening, higher financing costs and margin calls. Multi-asset portfolios should be tested for simultaneous declines and hedge failures. Maximum drawdowns occurring at different times across assets must not simply be added and described as an actual portfolio loss. Risk limits must reflect available cash, the time needed to liquidate holdings and the ability to meet additional margin requirements. Without these inputs, scenario amounts can be calculated, but losses cannot be judged “affordable” or “within limits.” Actual futures P&L must be checked against the relevant contract quotations, multipliers and daily settlement rules; nonlinear instruments such as options require repricing.

Research conclusion

Historical drawdowns help explain path-dependent risk, while dollar scenarios describe the financial consequences of a specified exposure. Both are needed. Extreme losses absent from the historical sample may still occur; this report therefore does not present drawdown statistics as VaR, a guaranteed loss bound or a promise of stop-loss execution. View the drawdown chart · Read the bond interest rate sensitivity case Download price data. This report uses three price series in the file to calculate drawdown. Prepared: January 2026. Download the research calculation summary.

Related research

2025 Treasury Term Spread: Changes and Analytical Limits

2025 Treasury Term Spread: Changes and Analytical Limits

Decompose short- and long-end contributions to the yield spread, examine curve steepening and distinguish portfolio risk from bank net interest margin.
2025 Multi-Asset Allocation Research: Returns, Correlations and Diversification

2025 Multi-Asset Allocation Research: Returns, Correlations and Diversification

Compare full-sample and short-window correlations, examine cross-asset behavior during equity stress and define the limits of allocation conclusions.
2025 U.S. Treasury Yields: Short-End and Long-End Changes

2025 U.S. Treasury Yields: Short-End and Long-End Changes

Compare short- and long-end yields by quarter, distinguishing yield direction, curve shifts and their effects on cash-flow valuation.