ResearchPrepared: January 2026

2025 Gold Review: Rally, Pullback and Recovery

Observation period

The GC=F OHLCV sample covers 63 trading days from 2025-09-02 to 2025-11-28. Prices are in USD per troy ounce; volume is measured in contracts. Candlesticks, MA5 and volume use actual observations. The zones and A/B/C labels are research annotations. Open the interactive candlestick chart · Download OHLCV data

A · Peak and pullback

On October 20, the high was 4,398.0 and the close was 4,359.4. The next day closed at 4,109.1, approximately 5.74% below the previous close. This describes an observed change between adjacent closing prices.

B · Stabilization near lows

On October 28, the low was 3,901.3 and the close was 3,983.1. On October 29, the low was 3,930.0 and the close was 4,000.7. The support observation zone is placed near these two recorded lows; the recovery description is based on observed prices.

C · Rebound validation

The November 13 high was 4,250.0, followed by a November 14 close of 4,094.2. The November 28 close of 4,254.9 exceeded the upper boundary of the 4,200—4,250 observation zone. One close above the zone still requires subsequent data, beyond the observation period, to establish whether that level holds.

Annotation methodology

AnnotationObservations and methodology
AHigh of 4,398.0 on October 20
BLow of 3,901.3 on October 28
CClose of 4,254.9 on November 28
Line connecting highsConnects the October 20 high to the November 13 high
Support observation zone3,901.3-3,930.0, based on two observed lows
Resistance observation zone4,200-4,250: the upper boundary is the November 13 high; 4,200 is the analyst-selected lower boundary
MA5Arithmetic mean of the closing prices of the last 5 valid trading days

Research limitations

Futures price series may be affected by contract rolls. Zones and connecting lines are retrospective research annotations and cannot independently establish trading profitability. Volume measures trading activity; it does not by itself reveal the direction of capital flows.

Related research

2025 Treasury Term Spread: Changes and Analytical Limits

2025 Treasury Term Spread: Changes and Analytical Limits

Decompose short- and long-end contributions to the yield spread, examine curve steepening and distinguish portfolio risk from bank net interest margin.
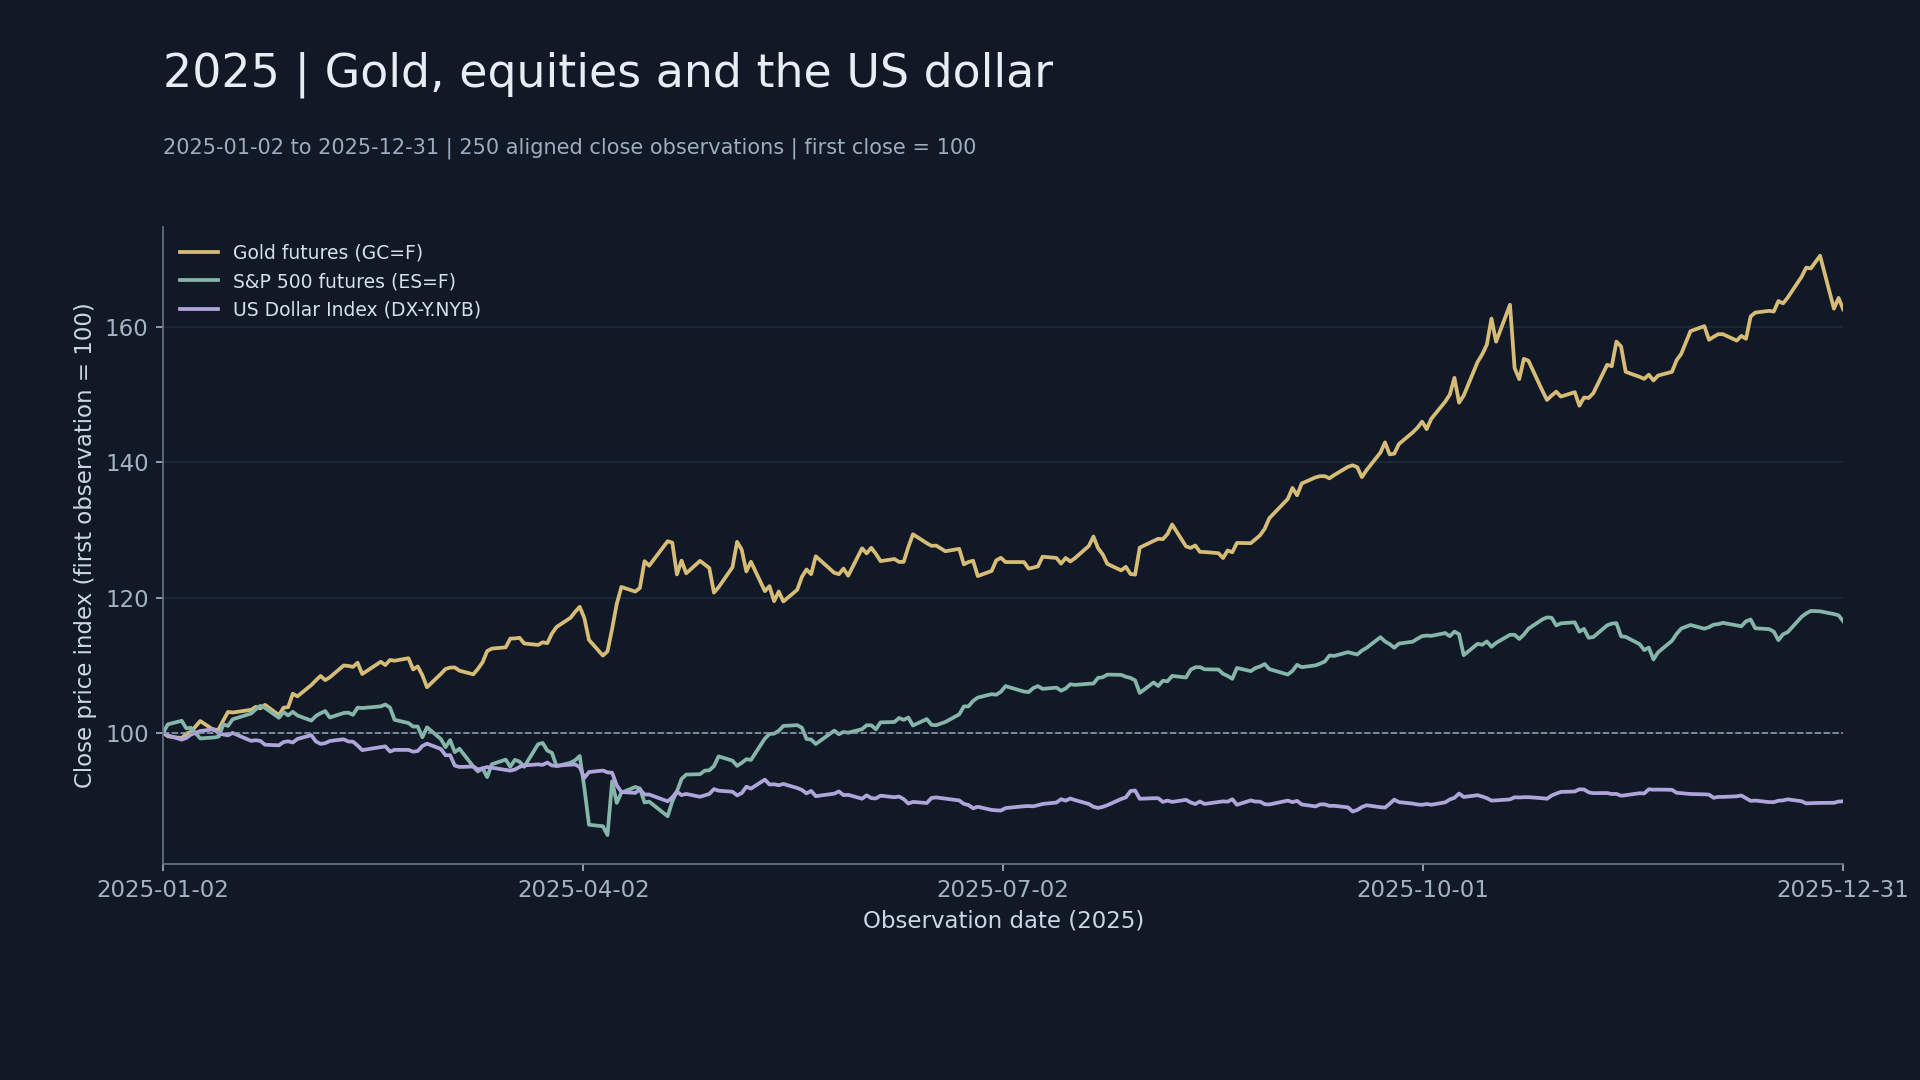
2025 Multi-Asset Allocation Research: Returns, Correlations and Diversification

2025 Multi-Asset Allocation Research: Returns, Correlations and Diversification

Compare full-sample and short-window correlations, examine cross-asset behavior during equity stress and define the limits of allocation conclusions.
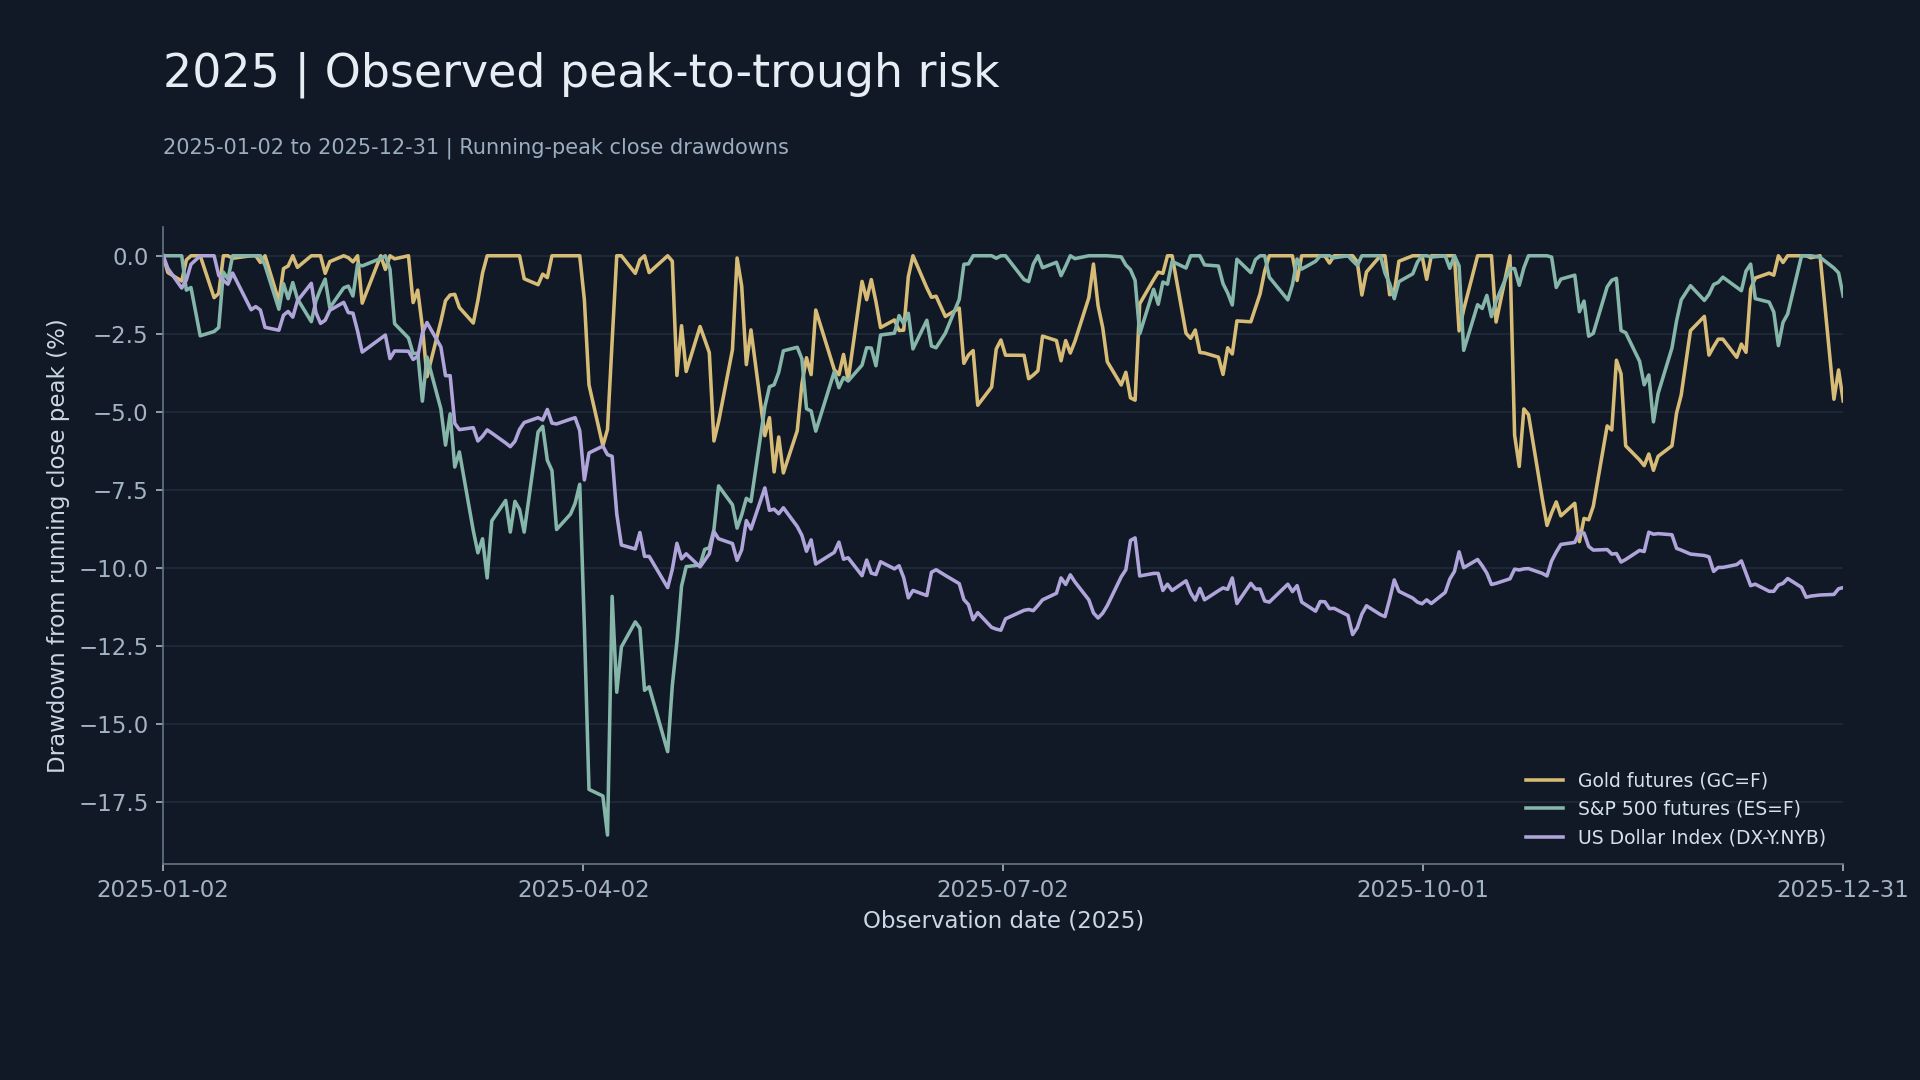
2025 Observed Drawdowns and Dollar Risk Scenarios

2025 Observed Drawdowns and Dollar Risk Scenarios

Identify observed peaks, troughs and recovery dates; examine recovery requirements and distinguish notional exposure, account equity and scenario P&L.
2025 U.S. Treasury Yields: Short-End and Long-End Changes

2025 U.S. Treasury Yields: Short-End and Long-End Changes

Compare short- and long-end yields by quarter, distinguishing yield direction, curve shifts and their effects on cash-flow valuation.