Research JournalResearch month 2025-07 · Prepared:January 2026

July Review | Intra-Month U.S. Dollar Price Changes

Olivia Rose Guthorn
July Review | Intra-Month U.S. Dollar Price Changes
Research month

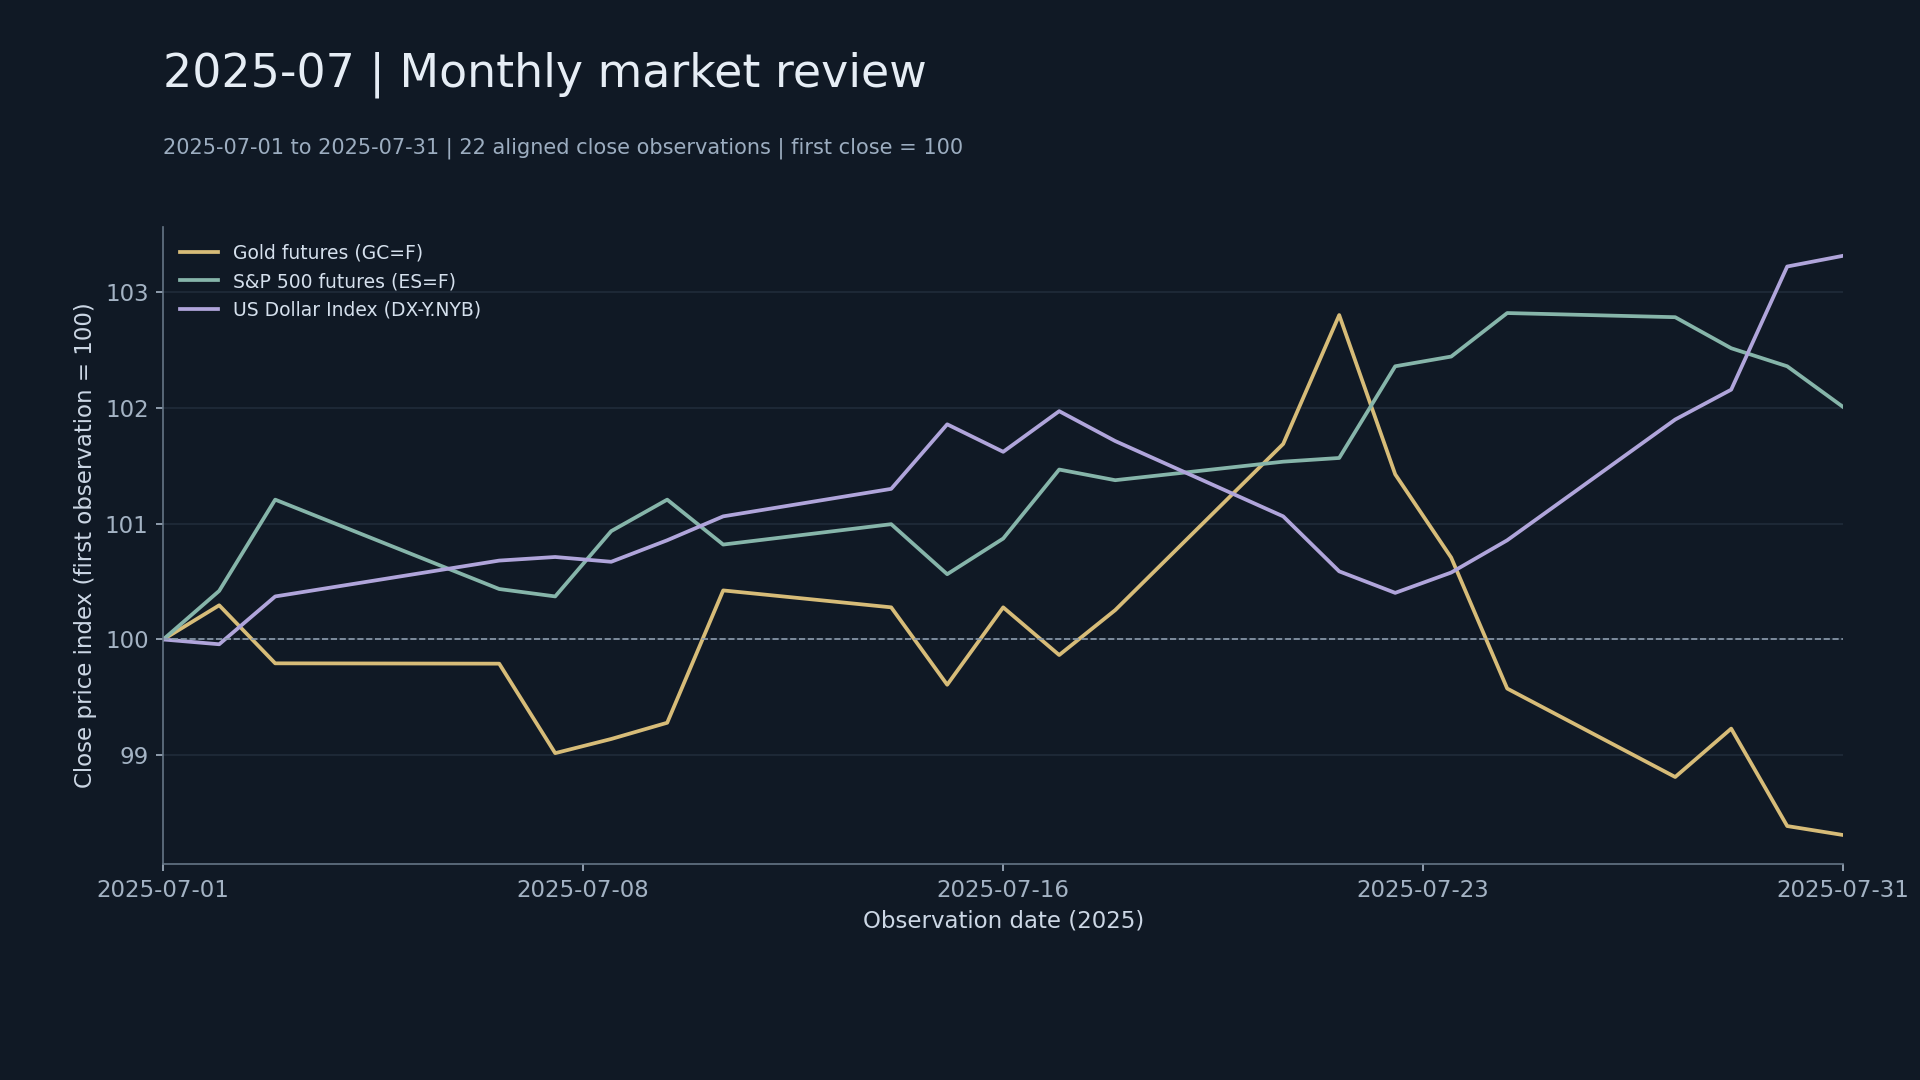
July 2025: 2025-07-01 to 2025-07-31, with 22 comparable trading days. This review is archived by research month and was prepared in January 2026.

Monthly observations

IndicatorsChanges within observation periods
Gold Futures GC=F-1.69%
S&P 500 Futures ES=F+2.01%
U.S. Dollar Index DX-Y.NYB+3.32%
^TNX Yield+10.9 bp
For comparison, all three price series are rebased to 100 at the first observation’s close. Period returns start from that close and exclude the move from the previous month-end to the first trading day of this month.

Research question

What price paths between the first and last observations does an endpoint comparison miss?

Observations and conclusions

Gold fell 1.69%, equity index futures rose 2.01%, and the dollar rose 3.32%. The three markets moved in different directions over the observation period. Their paths within the chart also matter; starting and ending prices alone cannot explain the causes.

Follow-up review

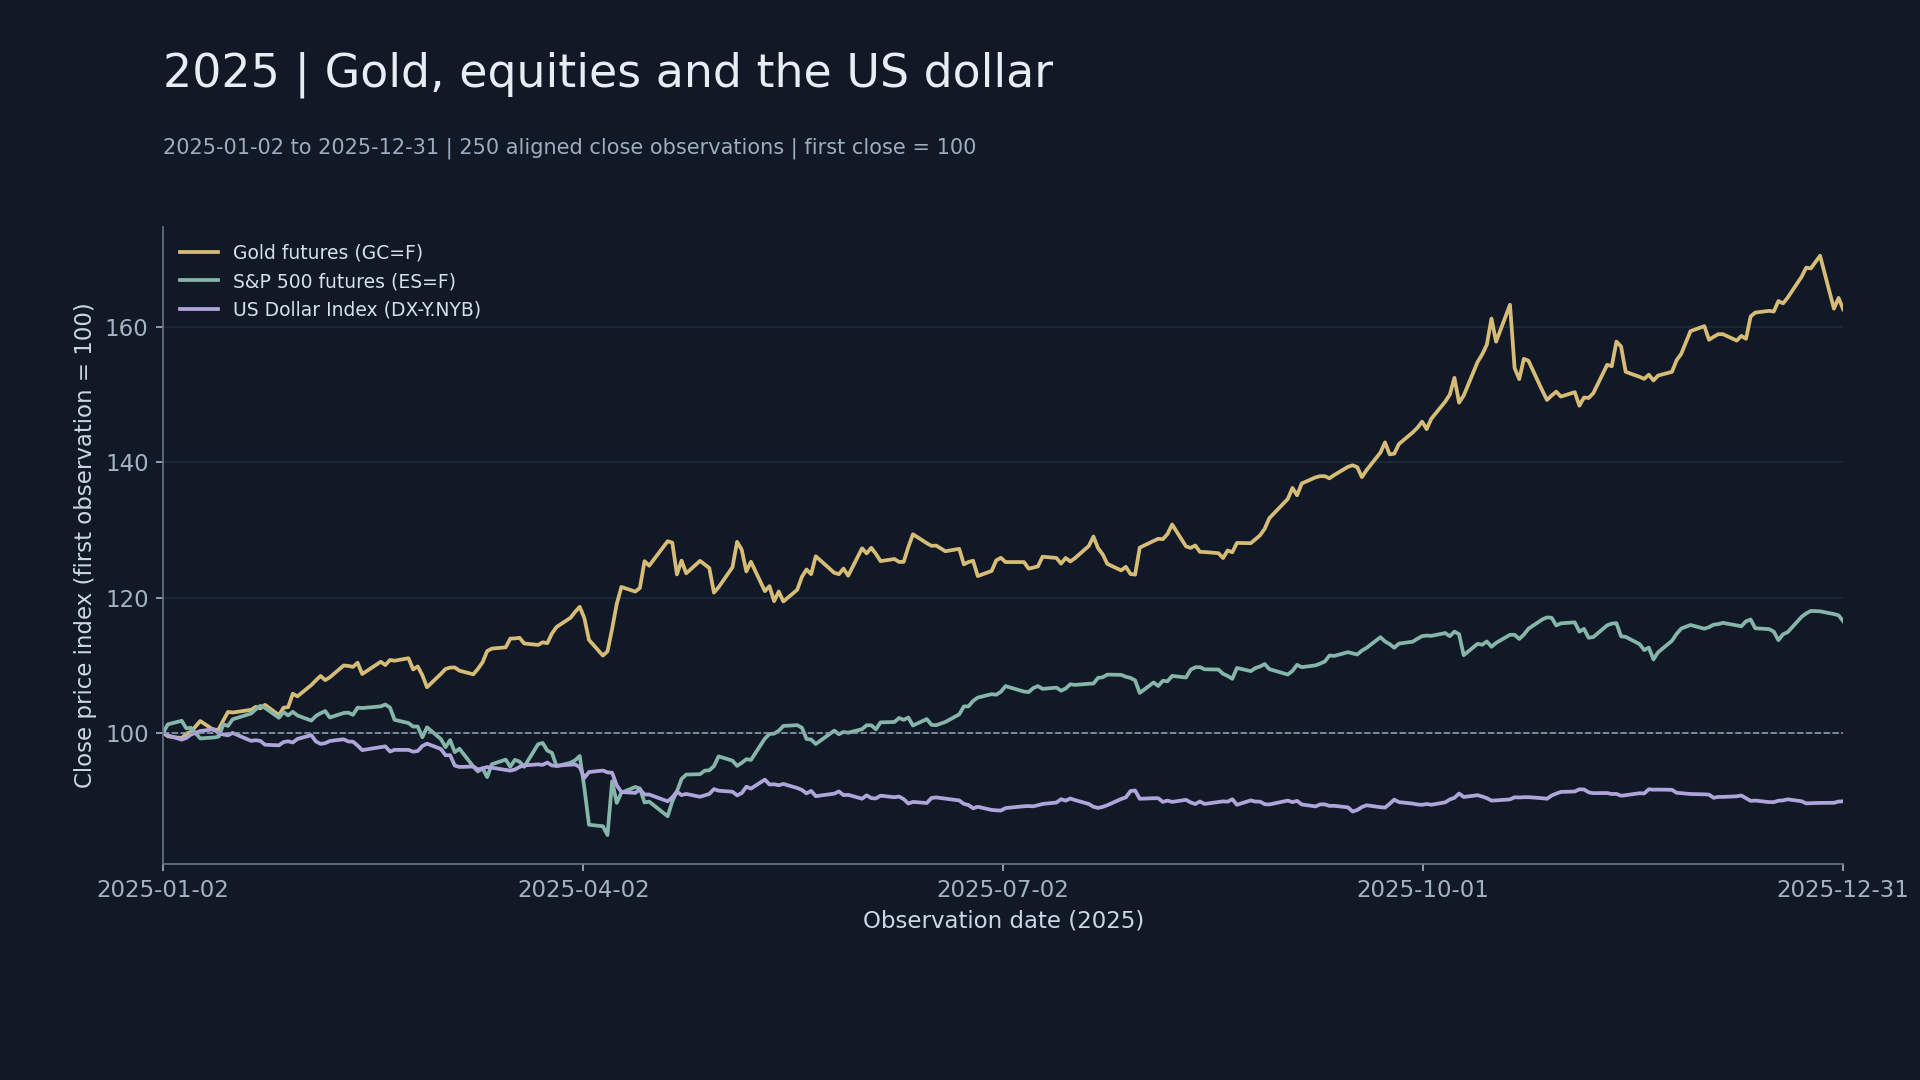
Compare adjacent months and the full-year chart using the same comparable-trading-day and price-return conventions. Examine whether short-term market relationships change with the observation period, and distinguish price changes from actual portfolio performance. Download 2025 market data. Futures price series may be affected by contract rolls.
Share this article: